What the recent yield curve inversion does and doesn’t tell us
We economists like to remind investors that expansions don’t die of old age. Yet the markets have grown increasingly concerned about the risk of a U.S. recession as the economy nears the end of its tenth year of expansion.
That concern ratcheted up a notch toward the end of March 2019 when the yield curve inverted, with the yield of the 10-year U.S. Treasury note briefly falling below that of the 3-month Treasury bill.
What an inversion has meant in the past
The Nobel Prize-winning economist Paul Samuelson once joked that the stock market has predicted nine of the past five recessions. The bond market, on the other hand, has been a very reliable canary in the coal mine.
Over the past 50 years, a yield curve inversion lasting for a sustained period has preceded every one of the seven recessions in that time.
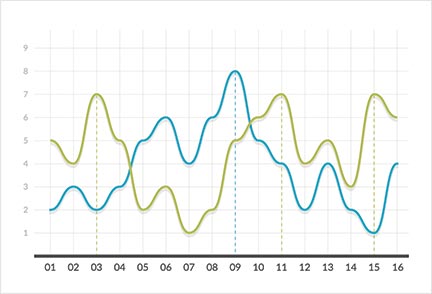
Yield curve inversions have preceded recessions
Note: Data are from January 2, 1968, through April 11, 2019.
Sources: Vanguard, Moody’s Data Buffet, and Federal Reserve Bank of St. Louis.
This time isn’t different…
Since the Federal Reserve began hiking short-term interest rates in 2015, the slope of the Treasury yield curve has flattened by more than 3 percentage points. And then, on March 22, 2019, the 10-year Treasury yield slipped to 2.44%, putting it just under the 3-month Treasury yield of 2.46%. The inversion lasted just five days, so it’s not (so far) the kind of persistent inversion that we’ve seen in the past before the onset of recessions.
Some subscribe to the view that an inversion in the current interest rate environment does not have the same power to predict a recession as in the past. Their reasoning is that the bond market has been distorted by the Fed’s massive quantitative-easing (QE) program, in which it bought longer-term Treasuries to hold down their yields.
While this environment is unusual, even unprecedented, our analysis suggests that the yield curve’s relevance as a growth signal endures in the QE era.1 We would therefore caution against ignoring what the yield curve can tell us or disregarding the warning of an economic slowdown that an inversion provides.
…but the timing might be
The lag between a yield curve inversion and the subsequent recession has varied considerably in the past. Over the last half century, it has ranged between 5 and 17 months. There are a number of reasons to think a recession this time around might take longer to materialize. The March inversion didn’t last long. Fed monetary policy is still accommodative by most measures, whereas historically during inversions it has been squarely in restrictive territory.
And recently, the Fed signaled it would be more patient in raising rates and might allow inflation to overshoot its 2% target, limiting the likelihood that short-term yields will move much higher anytime soon.
More broadly speaking, our quantitative assessment of the U.S. economy is that current fundamentals are healthier than they have been just before prior recessions, including the global financial crisis and the dot.com bust2 Households have reduced debt over the past decade and corporate balance sheets still look solid (despite some weak links such as leveraged loans and high-yield debt in the energy sector).
All that is to say we believe that a yield curve inversion is still a reliable recession indicator—and that the next recession is probably not just around the corner. Our base case is a 35% chance of a recession in the next 12 months.
What do our projections mean for your portfolio?
With the economy expected to slow and tip into recession at some point, U.S. portfolio returns likely will be more muted over the next five years than they have been for the past five years.
But it’s not all bad news. We anticipate fixed income assets will benefit from a marginally higher interest rate environment and continue to provide diversification in periods of heightened macroeconomic and equity market volatility.
And keep in mind that recessions over the past 50 years have ranged in length between 6 and 18 months. If your investment time horizon is much longer than that, you’re likely to be better off staying the course and enduring the attendant volatility than attempting to time the economy and the markets.
1 Roger Aliaga-Díaz, et al., 2018. Global Macro Matters—Rising Rates, Flatter Curve: This Time Isn’t Different, It Just May Take Longer. Valley Forge, Pa.: The Vanguard Group.
2 Davis, Joseph H., et al., 2018. Vanguard Economic and Investment Outlook for 2019: Down But Not Out. Valley Forge, Pa.: The Vanguard Group.
Note:
All investing is subject to risk, including the possible loss of the money you invest. Investments in bonds are subject to
interest rate, credit, and inflation risk. Diversification does not ensure a profit or protect against a loss.